Market Depth and Liquidity Analysis: A Practical Guide for Crypto Traders
Jul, 14 2026
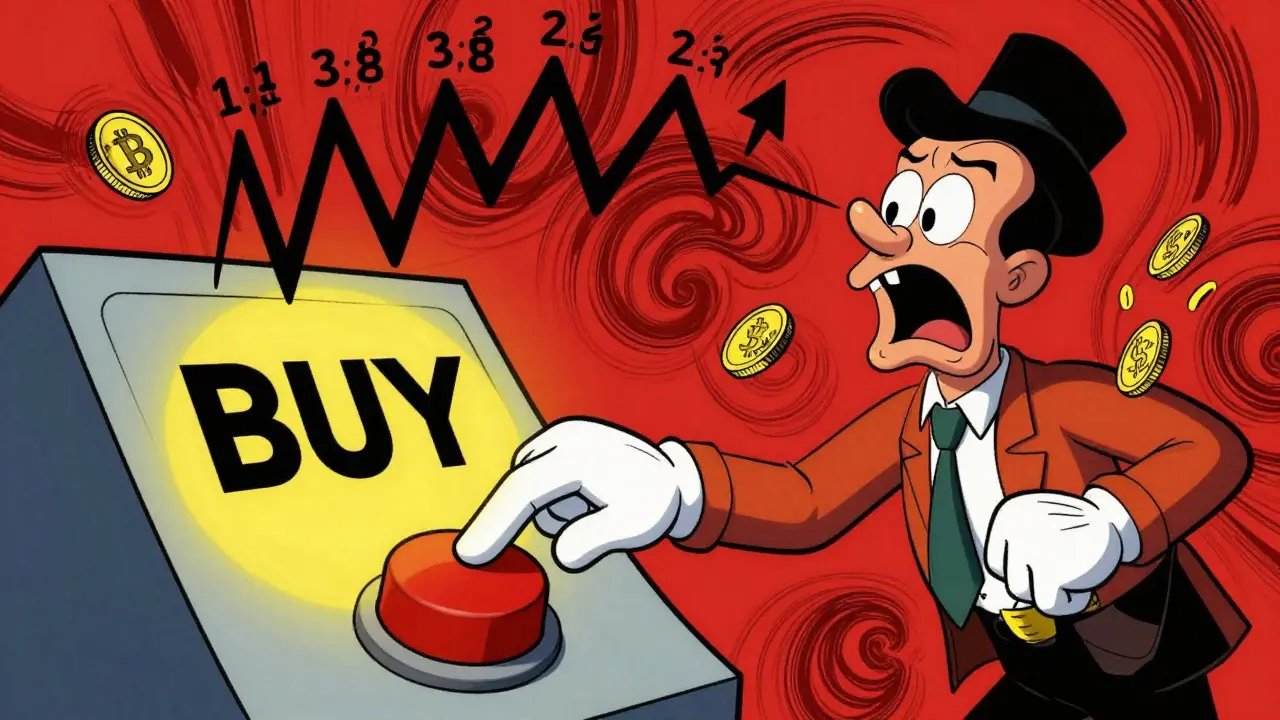
Imagine you are trying to buy a large block of Bitcoin. You click 'buy,' but instead of filling at the current price, your order gets executed across ten different prices, each slightly higher than the last. Your average entry price is worse than you expected, and you have lost money before you even started trading. This phenomenon is known as slippage, and it happens because the market lacked sufficient liquidity, which is the ability to trade an asset quickly without causing significant price changes.
To avoid this, traders need to understand market depth, which is a measure of the market's ability to sustain larger orders without impacting the security's price. While many retail traders focus solely on price charts, professional traders look beneath the surface at the order book. Market depth reveals the total number of buy and sell orders waiting at various price points. It tells you how much resistance or support exists before the price moves significantly.
Understanding the Core Concepts: Depth vs. Liquidity
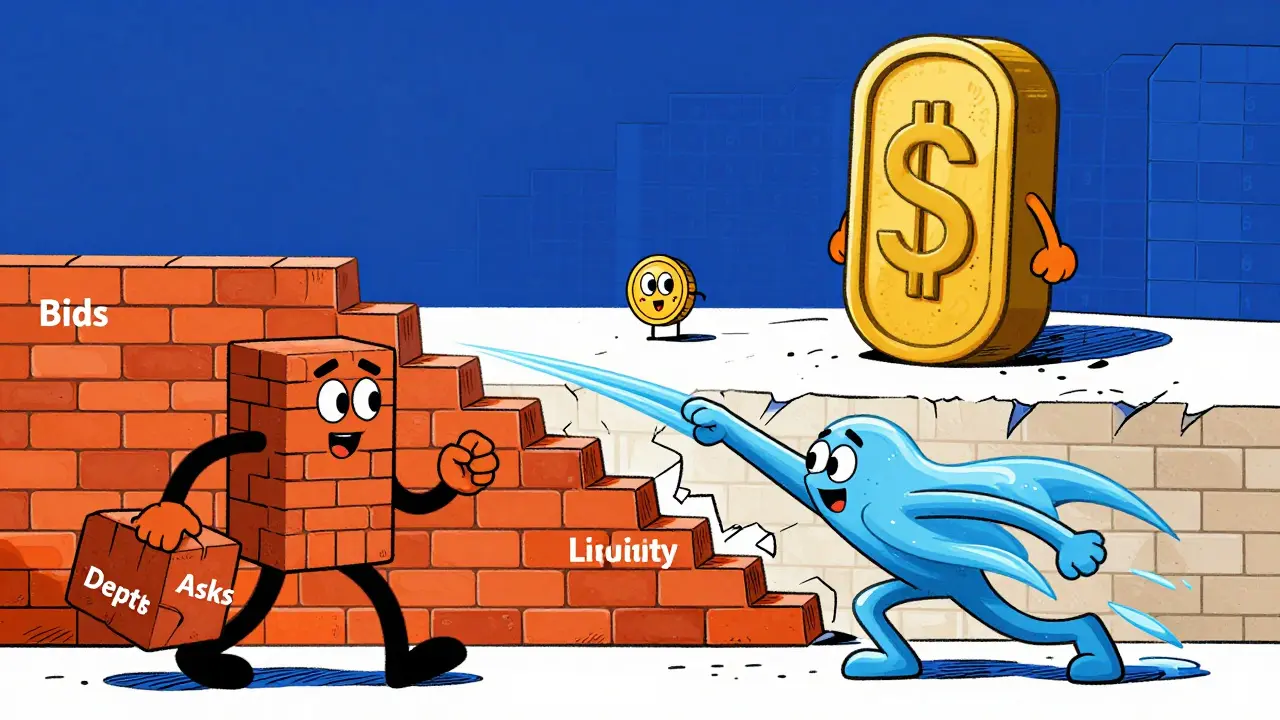
People often use the terms "depth" and "liquidity" interchangeably, but they are distinct concepts that work together. Think of liquidity as the ease with which you can enter or exit a position. Depth is the structural reason why that liquidity exists. If a market has high depth, it means there are many resting orders-both bids (buy) and asks (sell)-stacked up in the order book. These resting orders act as a buffer, absorbing large trades without sending the price skyrocketing or crashing.
The Federal Reserve’s working paper from February 2025 defined market depth formally as "the availability of resting orders to trade." This definition highlights a critical relationship: when depth shrinks, liquidity becomes fragile. In traditional markets like US Treasuries, depth is massive. However, in cryptocurrency markets, depth can be surprisingly shallow compared to traditional assets. For example, data from Keyrock in Q3 2024 showed that the median 2% depth for BTC-USD on Coinbase Pro was only $8.7 million. Compare that to the $1.2 billion median 2% depth in major Treasury securities. That is a 99.3% difference in available liquidity within a tight price range. This disparity explains why crypto prices can swing violently on relatively small volume events that would barely ripple a stock market.
How to Measure Market Depth
You cannot measure market depth with a single number; it requires looking at three interconnected facets: order flow, volume, and the Depth of Market (DOM). Order flow tracks the rate at which new buy and sell orders enter the system. Strong, consistent order flow indicates a healthy, deep market. Volume tells you how much activity occurred over a specific period, but it doesn't show you what is *waiting* to happen. That is where the DOM comes in.
The DOM is a real-time visualization, often called a "ladder," that displays cumulative order quantities at each price level. Most standard trading platforms show the top 10 to 20 levels above and below the current price. A key metric used by analysts is the "2% depth." This measures the total liquidity available in the order book at prices 2% above and below the current market price. According to the Corporate Finance Institute, a market is considered "deep" if a $1 million trade moves the price less than 0.1%. If that same trade moves the price more than 0.5%, the market is "shallow." Understanding these thresholds helps you gauge whether a market can handle your specific trade size without slipping.
Comparing Asset Classes: Where Does Crypto Stand?
Not all markets are created equal when it comes to depth. To make informed decisions, you must compare the asset you are trading against others. Traditional stock markets sit between the extremes of government bonds and cryptocurrencies. For instance, Apple (AAPL) on NASDAQ showed a median 2% depth of $42.3 million in August 2024. This is deeper than most altcoins but significantly shallower than blue-chip stocks or government bonds.
| Asset Class | Example Instrument | Median 2% Depth | Liquidity Profile |
|---|---|---|---|
| Treasuries | 10-Year Note | $1.2 Billion | Very Deep |
| Equities | Apple (AAPL) | $42.3 Million | Moderately Deep |
| Cryptocurrency | BTC-USD (Coinbase) | $8.7 Million | Shallow |
This table illustrates why institutional investors approach crypto differently. They cannot dump millions of dollars into a single exchange without moving the market. They must use algorithms to slice orders, relying on depth analysis to find pockets of liquidity across multiple venues. For retail traders, this means understanding that while Bitcoin is liquid relative to other coins, it is still fragile compared to traditional finance.
The Hidden Dangers: Spoofing and Fragility
One of the biggest risks in relying on market depth is that it can be faked. High-frequency trading (HFT) algorithms often place large orders to create the illusion of depth, only to cancel them milliseconds before execution. This practice is known as spoofing. A study by the International Organization of Securities Commissions found that 41.7% of apparent market depth in equity markets disappears within 500 milliseconds. In crypto, where regulation is looser, this risk is even higher.
Traders on forums like TradingView have reported experiencing "DOM spoofing" on crude oil futures and major crypto pairs. For example, users noticed massive buy walls at specific price levels that vanished just as the price approached, leading to sudden drops. Dr. Emily Zhao, a finance professor at Stanford, warned in June 2024 that "overreliance on visible market depth can be dangerous as high-frequency trading algorithms increasingly employ iceberg orders and other techniques to mask true liquidity availability." Iceberg orders are hidden limit orders that only show a small portion of their total size, making the market appear shallower than it actually is. Conversely, spoofing makes it appear deeper. Learning to distinguish between genuine liquidity and artificial signals is a critical skill for any serious trader.

Tools and Implementation for Retail Traders
You do not need to be a Wall Street institution to benefit from market depth analysis, but you do need the right tools. Basic charting software often lacks detailed DOM features. Professional-grade platforms like Bookmap ($299/month) or Quantower ($149/month) provide visual heatmaps of order book data, allowing you to see historical depth and identify support/resistance levels based on actual orders rather than just past prices.
For those who cannot afford premium subscriptions, free resources exist. The CME Group offers free DOM tutorial videos, and communities like the r/algotrading subreddit share insights on reading order books. However, there is a steep learning curve. Educational platforms estimate 50-80 hours of dedicated study to achieve proficiency. You must learn to interpret DOM in conjunction with volume profiles and recognize patterns like persistent buy orders accumulating at a specific price, which can indicate strong support.
Latency is another practical challenge. In fast-moving crypto markets, a delay of 50 milliseconds can render DOM data obsolete. If you are using a slow internet connection or a platform with poor direct market access (DMA), you may be reacting to information that no longer exists. Always test your setup in a simulated environment before risking real capital. Professional traders recommend at least three months of paper trading to master depth analysis.
Future Trends: AI and Regulatory Changes
The landscape of liquidity analysis is evolving rapidly. Artificial intelligence is beginning to play a role in predicting depth changes. Tools like Tradespoon’s DeepLiquidity AI, launched in August 2024, use machine learning to predict depth shifts with over 70% accuracy based on historical patterns. This allows traders to anticipate liquidity dry-ups before they happen.
Regulatory scrutiny is also increasing. Following volatility events in traditional markets, bodies like the SEC and the Basel Committee are pushing for standardized market depth disclosure requirements. In crypto, this could mean exchanges being required to report more transparently about order cancellations and hidden orders. As transparency improves, the gap between perceived and actual depth should narrow, making analysis more reliable for everyone.
What is the difference between market depth and liquidity?
Liquidity refers to how easily you can buy or sell an asset without affecting its price. Market depth is the underlying structure that enables liquidity, specifically the number of resting buy and sell orders at various price levels. High depth generally leads to high liquidity, but depth can be artificial (spoofed), whereas true liquidity reflects actual tradable volume.
How do I read a Depth of Market (DOM) ladder?
A DOM ladder shows price levels vertically, with bid sizes on the left and ask sizes on the right. Large numbers indicate significant interest at that price. If you see a huge buy wall below the current price, it suggests strong support. If you see a thin book above, the price may rise quickly with little selling pressure. Look for consistency over time, not just snapshots.
Why is crypto market depth so much lower than stocks?
Crypto markets are fragmented across hundreds of exchanges, meaning liquidity is spread out rather than concentrated. Additionally, fewer institutional players provide continuous two-way quotes compared to regulated stock exchanges. This fragmentation results in thinner order books on individual platforms, leading to lower measured depth per venue.
Can market depth analysis help me avoid slippage?
Yes. By analyzing the order book before placing a large market order, you can see how many orders are available at each price tier. If the book is thin, you might choose to use a limit order or split your trade into smaller chunks to minimize impact. Depth analysis allows you to plan entry and exit strategies based on actual available liquidity.
What is spoofing in market depth?
Spoofing is a manipulative tactic where traders place large fake orders to create the illusion of demand or supply, intending to move the price in their favor. These orders are canceled before they can be executed. It distorts market depth data, making the market appear deeper or more supportive than it truly is.